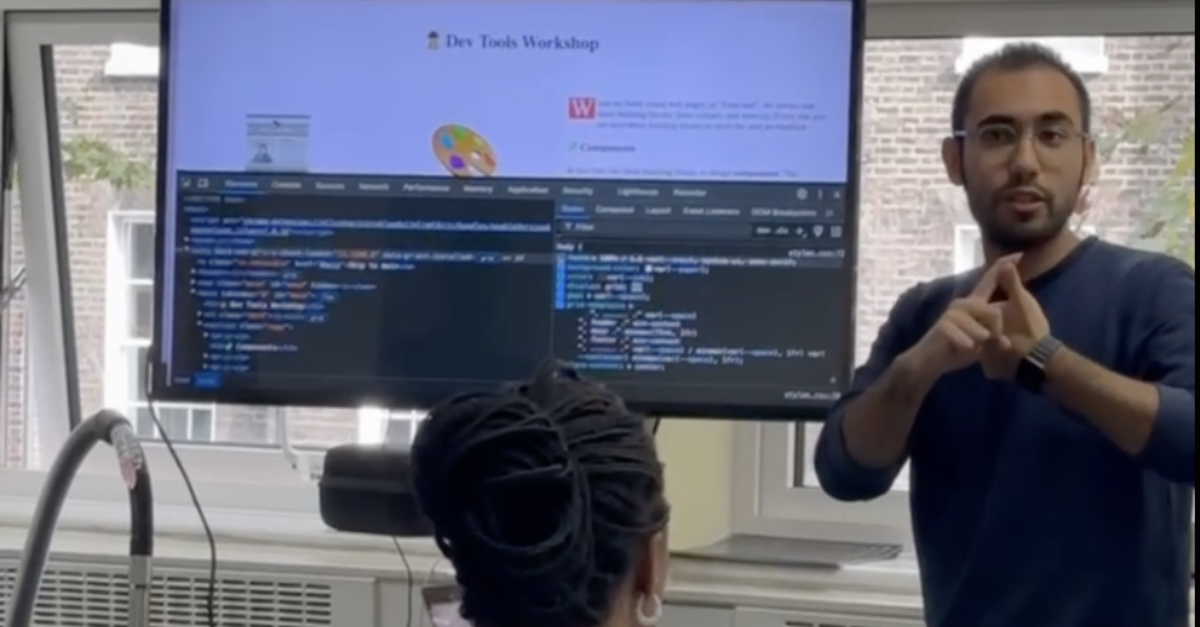
On October 12, 2024, I had the opportunity to conduct a hands-on Chrome DevTools workshop. This was a practical session aimed at helping trainees unlock the full potential of DevTools for inspecting, debugging, and optimizing their web projects.
You can find the links to my talk in three different parts:
- Part A: Start of the workshop, set up Link
- Part B: Doing Exercise Inspect the DOM Link
- Part C: Debugging the issues Link
The workshop was structured around real-world challenges and practical exercises. Participants were guided through the powerful tools hidden within Chrome DevTools, from the Elements Panel to Lighthouse Audits.
Here's what we covered:
The first exercise involved understanding the Document Object Model (DOM) and inspecting elements on the page. Key tasks included:
- Identifying CSS Variables used for design tokens (e.g., fonts, colours, and spacing).
- Modifying the page's styles directly within the Styles panel.
- Observing the effects of real-time changes to CSS properties.
To demonstrate how easily modern CSS can be adjusted, participants experimented with:
- Adjusting values of CSS variables (e.g.,
--spaceand--brand-color). - Predicting and observing the results of changes—like increasing font sizes or tweaking colours.
Modern websites rely on CSS Grid for layout. We explored:
- Enabling the Grid Badge in DevTools.
- Using the Grid Editor to manipulate and experiment with page layouts.
This exercise gave participants a new appreciation for how web layouts are visualized and debugged.
No DevTools session is complete without exploring Lighthouse. We ran audits to analyze performance, accessibility, and best practices. Lighthouse gave actionable feedback, helping participants identify issues and understand how to fix them.
- Issues were reviewed.
- Detailed explanations were explored, empowering developers to improve their code quality.
- Workshop Page: DevTools Workshop
- Chrome DevTools Docs: Google Developer Documentation
- Lighthouse Audits: Learn More